An analysis of the impact of the COVID-19 pandemic on Westwood businesses
By
Cameron Bian,
Eustina Kim,
Ziqing Luo,
Faye Zou,
Xuxin Zhang
Feb 16, 2021
Key Takeaways
Compared to the average numbers from 2018 and 2019, the number of Westwood businesses that opened and closed in 2020 decreased by 57.2% and 83.2%, respectively.
The ratio of closed businesses to open businesses was about 0.26 in 2020, the lowest in the last 20 years, meaning that there were still more business openings than business closures under the effect of the COVID-19 pandemic.
New businesses in Westwood are more vulnerable to the impact of the COVID-19 pandemic compared to old businesses.
The spread of COVID-19 has devastated many businesses across the U.S. According to Yelp’s Local Economic Impact Report released in September, “As of August 31, 163,735 total U.S. businesses on Yelp have closed since the beginning of the pandemic (observed as March 1), … with 60% of those closed businesses not reopening (97,966 permanently closed).” However, its annual 2020 report indicates that many businesses reopened toward the end of 2020, and new restaurants and other food businesses were opening near pre-pandemic levels. The Stack investigated trends in business openings and closures in Westwood before and during the pandemic to look into how the COVID-19 pandemic has impacted local businesses.
About the Data
The data was collected and provided by the Los Angeles Office of Finance.
Some of the graphs may not reflect the actual number of closed and opened businesses because of the following limitations:
The dataset was updated Dec. 23, so any changes after that are not accounted for in this analysis.
Some businesses may have closed forever but haven’t reported their closures to the Los Angeles Office of Finance yet. Thus, these businesses are still treated as active businesses in our datasets and analysis.
The data also includes independent home-based businesses which are registered with the owners’ names and located in some household addresses on the interactive map. We replaced those businesses’ names with “Home Business” for privacy reasons.
To find out the number of opened and closed businesses in Westwood in 2018, 2019 and 2020, explore the interactive map below and select the corresponding options that you wish to see in the top right corner.
Overview
Before studying the impact of the COVID-19 pandemic on Westwood businesses, it is important to have an overview of currently operating businesses. For more detailed information, you can find an updated list of the names of operating businesses here. The visualization below illustrates the number of operating businesses in each category. We grouped them into seven main categories on our own: shopping, daily service, dining, education, entertainment, medical and religious. Based on our analysis, by Dec. 20, the three most active business categories were dining with 81 operating businesses, daily service with 53 operating businesses and entertainment with 23 operating businesses. The names of all the subcategories with over five counts are printed out. Once again, we see that dining has the highest number of subcategories being printed out.
The map below shows an overview of business closures and openings from 2018 to 2020. Click the clusters to zoom in. You can also click the boxes in the right corner to observe the opened and closed businesses for each year.
Analysis
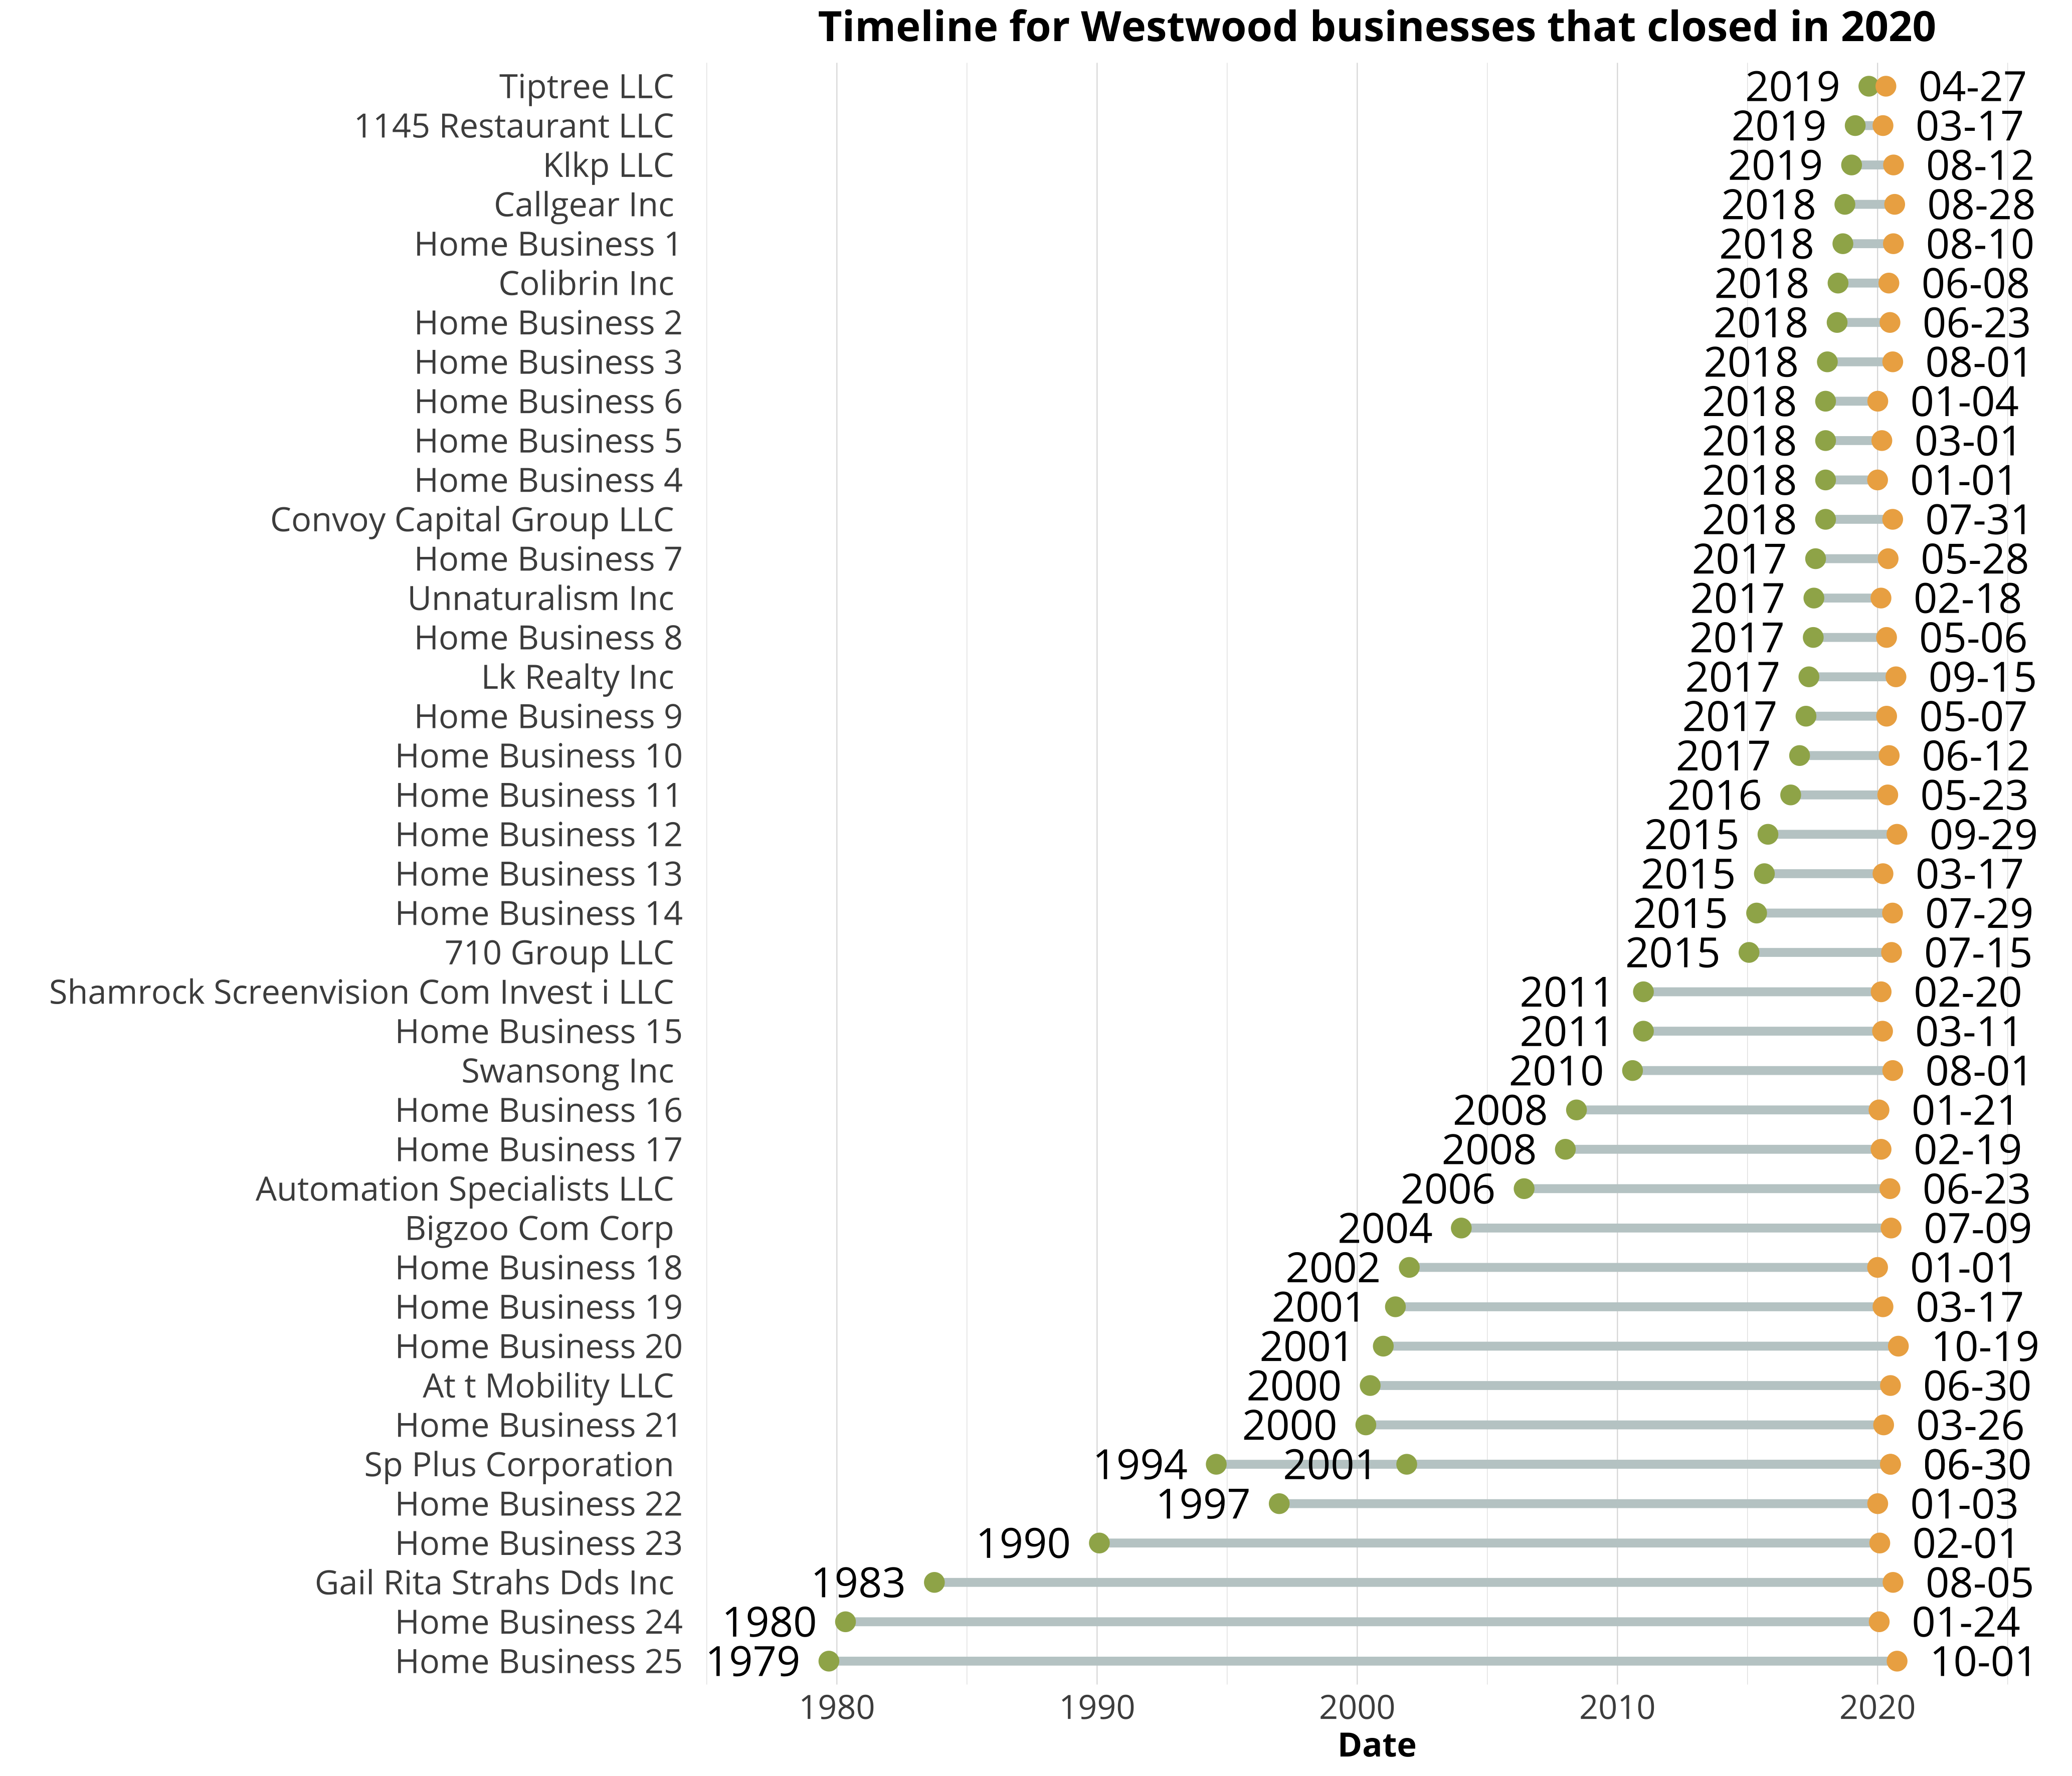
In the time plot below, we found that 41 businesses closed in 2020 by the beginning of December. More than half of those businesses first opened after 2015. Are newer businesses more vulnerable to the negative impacts of the COVID-19 pandemic?
<div class = chart-container”>
</div>
We labeled the businesses first opened before Jan. 1, 2015, as old businesses and those opened after this date as new businesses. We calculated the ratio between the number of closed businesses in 2020 and the number of currently active businesses for both old and new businesses. This ratio is used to reflect the vulnerability of old and new businesses to the economic impacts of the pandemic – the lower the ratio is, the more resistant the business is to the impacts of the COVID-19 pandemic. The result shows that the ratio for new businesses is 0.01143 (23 closed, 2,012 active), which is almost double the value of 0.005097 (19 closed, 3,729 active) for old businesses. Thus, we conclude that the new businesses are more susceptible to the effects of the COVID-19 pandemic.
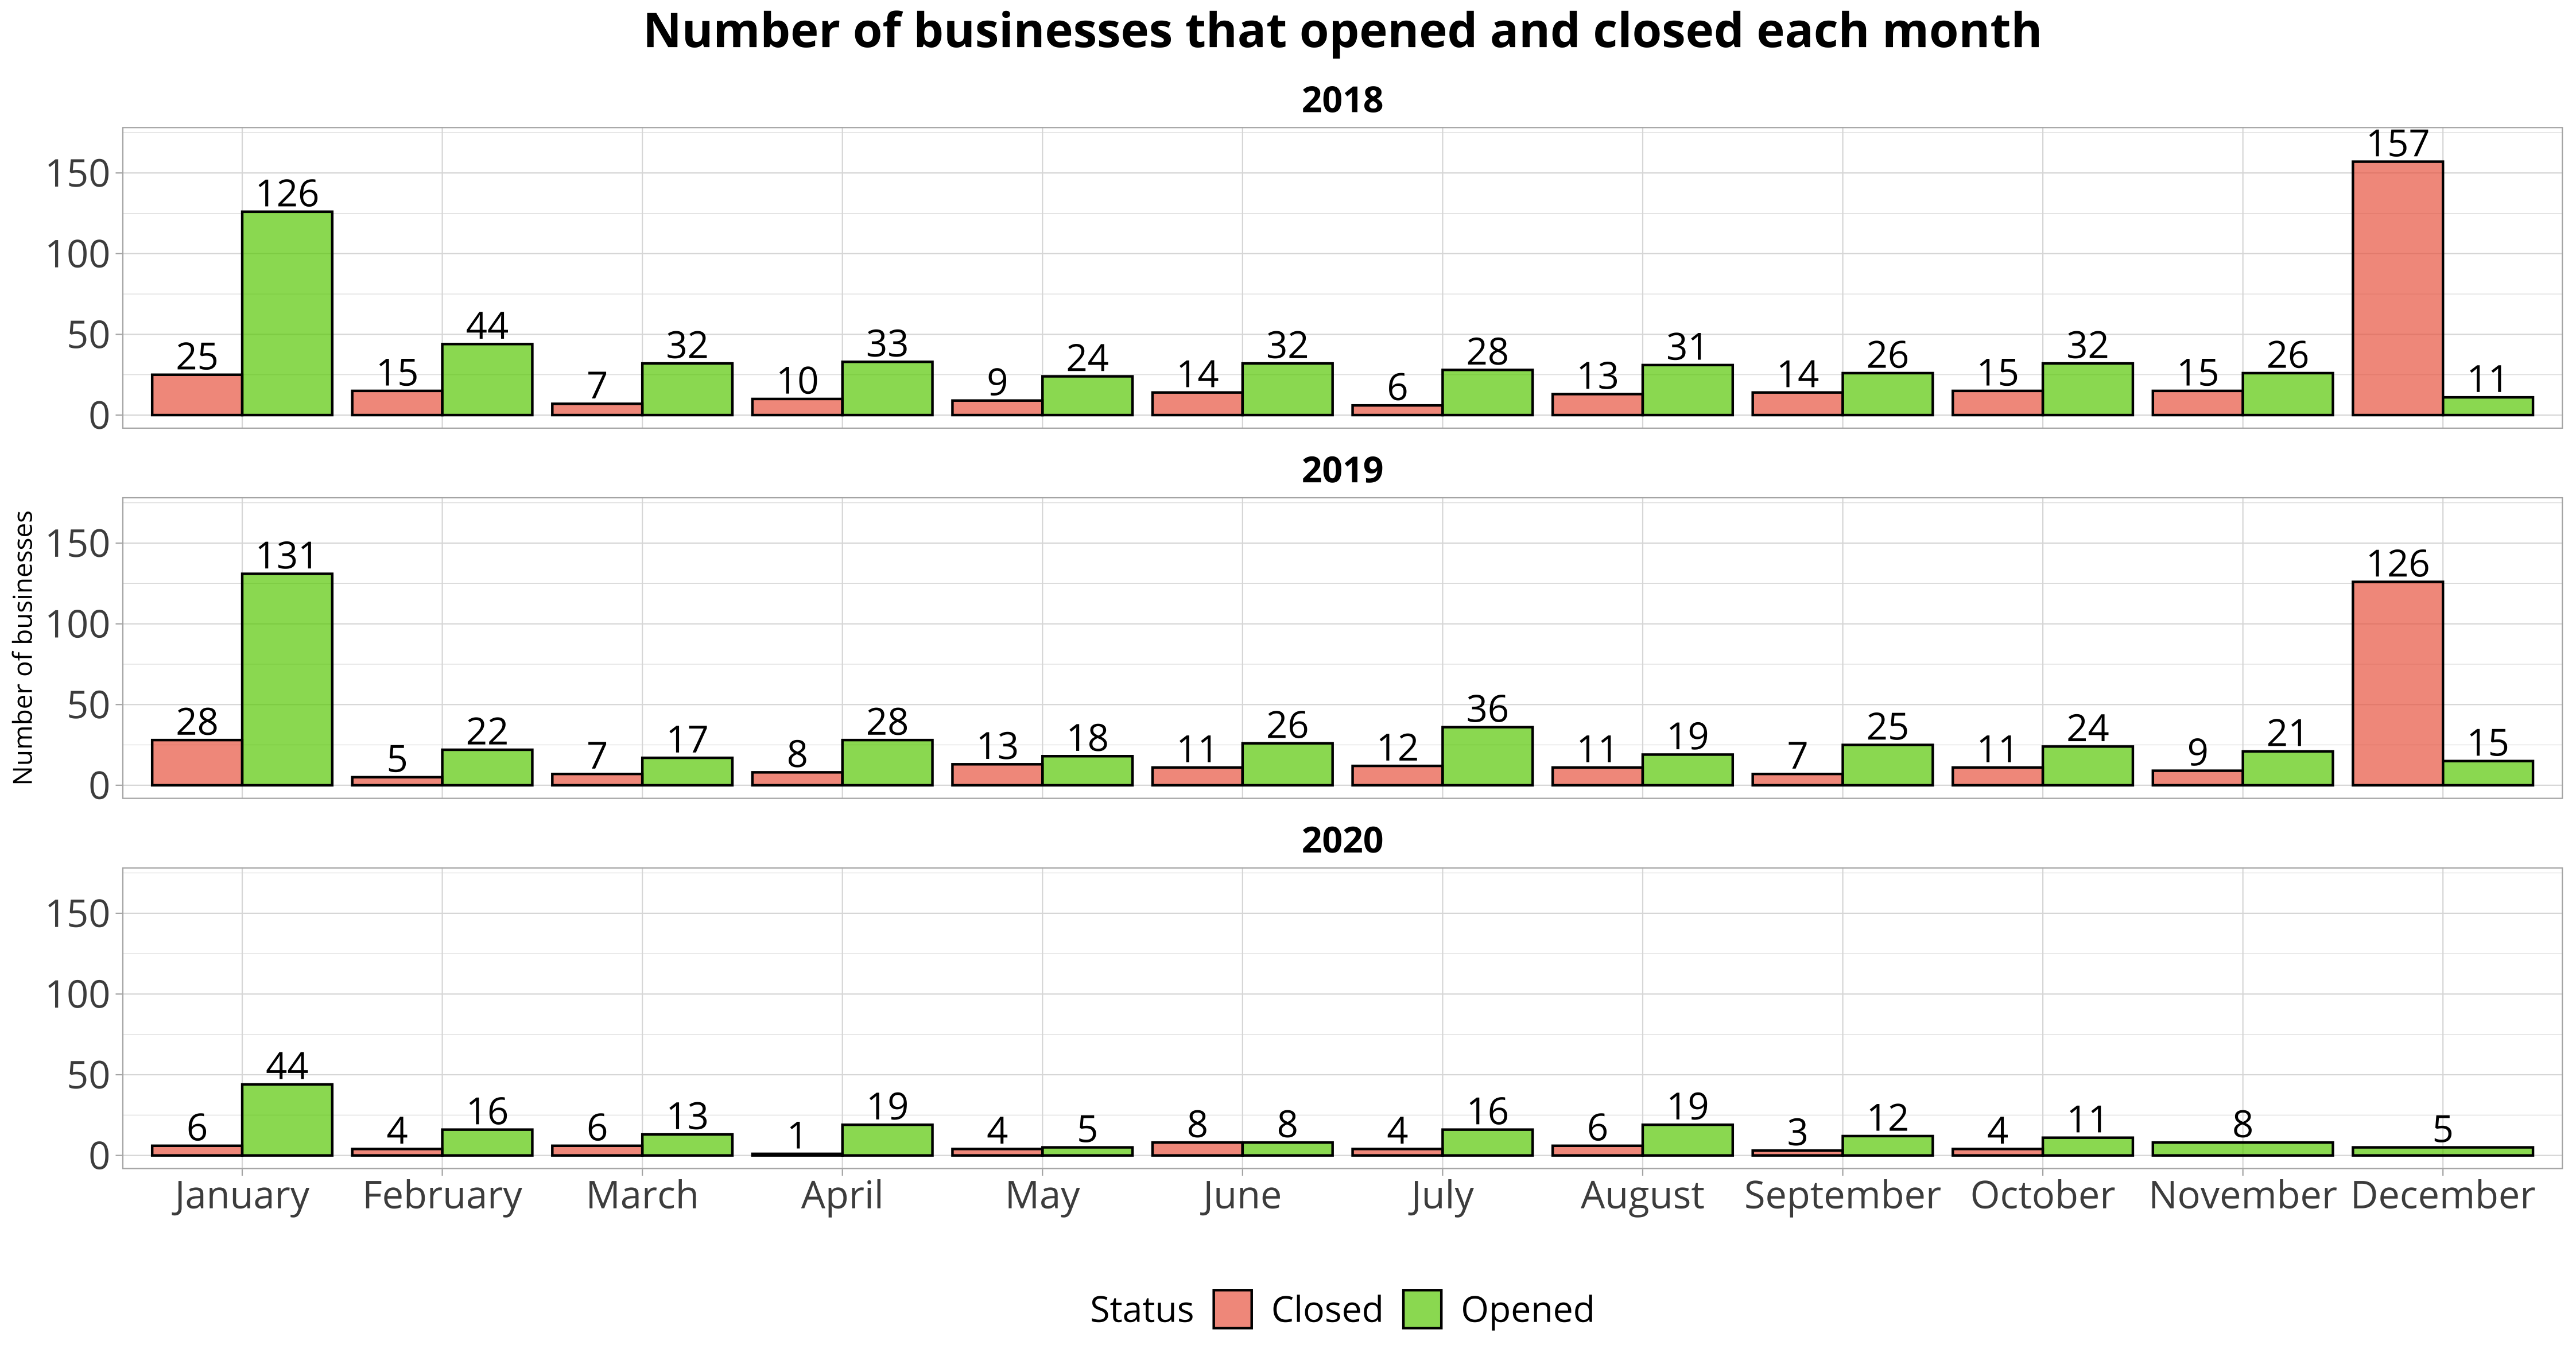
Compared to 2018 and 2019, there are considerably fewer businesses closed and opened for each month of 2020. On average, 4.6 businesses closed and 14.7 businesses opened monthly in 2020. In 2019, the average numbers of opening and closing businesses per month were 31.8 and 20.7, respectively. In 2018, an average of 37.1 businesses opened and 25 businesses closed each month.
Ian Flores, manager of Sharetea, spoke about business trends from his past experiences of working in Westwood.
“The general trend is that business goes down especially during breaks because all of the students leave,” Flores said. “So it was even harder when we’ve lost a lot of customers when kids had to go back home already because … there’s no in-class stuff.”
Shehbaz Mattu, the owner of the 7-Eleven store in Westwood, expressed disappointment about the lack of business in Westwood.
“We took the hardest hit out of most 7-Elevens because my sole customer base is UCLA: UCLA tourism, UCLA students, UCLA faculty, UCLA moms, dads and kids,” Mattu said. “(The) whole village is just a home to a lot of people and to see it become so scared and so (like a) ghost town, it’s just sad.”
“Opening a business in Los Angeles is not for the faint of heart,” said Andrew Thomas, the executive director of the Westwood Village Improvement Association. “The pandemic has only added to just the challenges that our businesses have to overcome in order to open.”
In addition, our data revealed a trend that many businesses open in January and close in December. According to Thomas, there are many possible explanations for this trend, such as that it may be hard to start a process to open a business toward the end of the year.
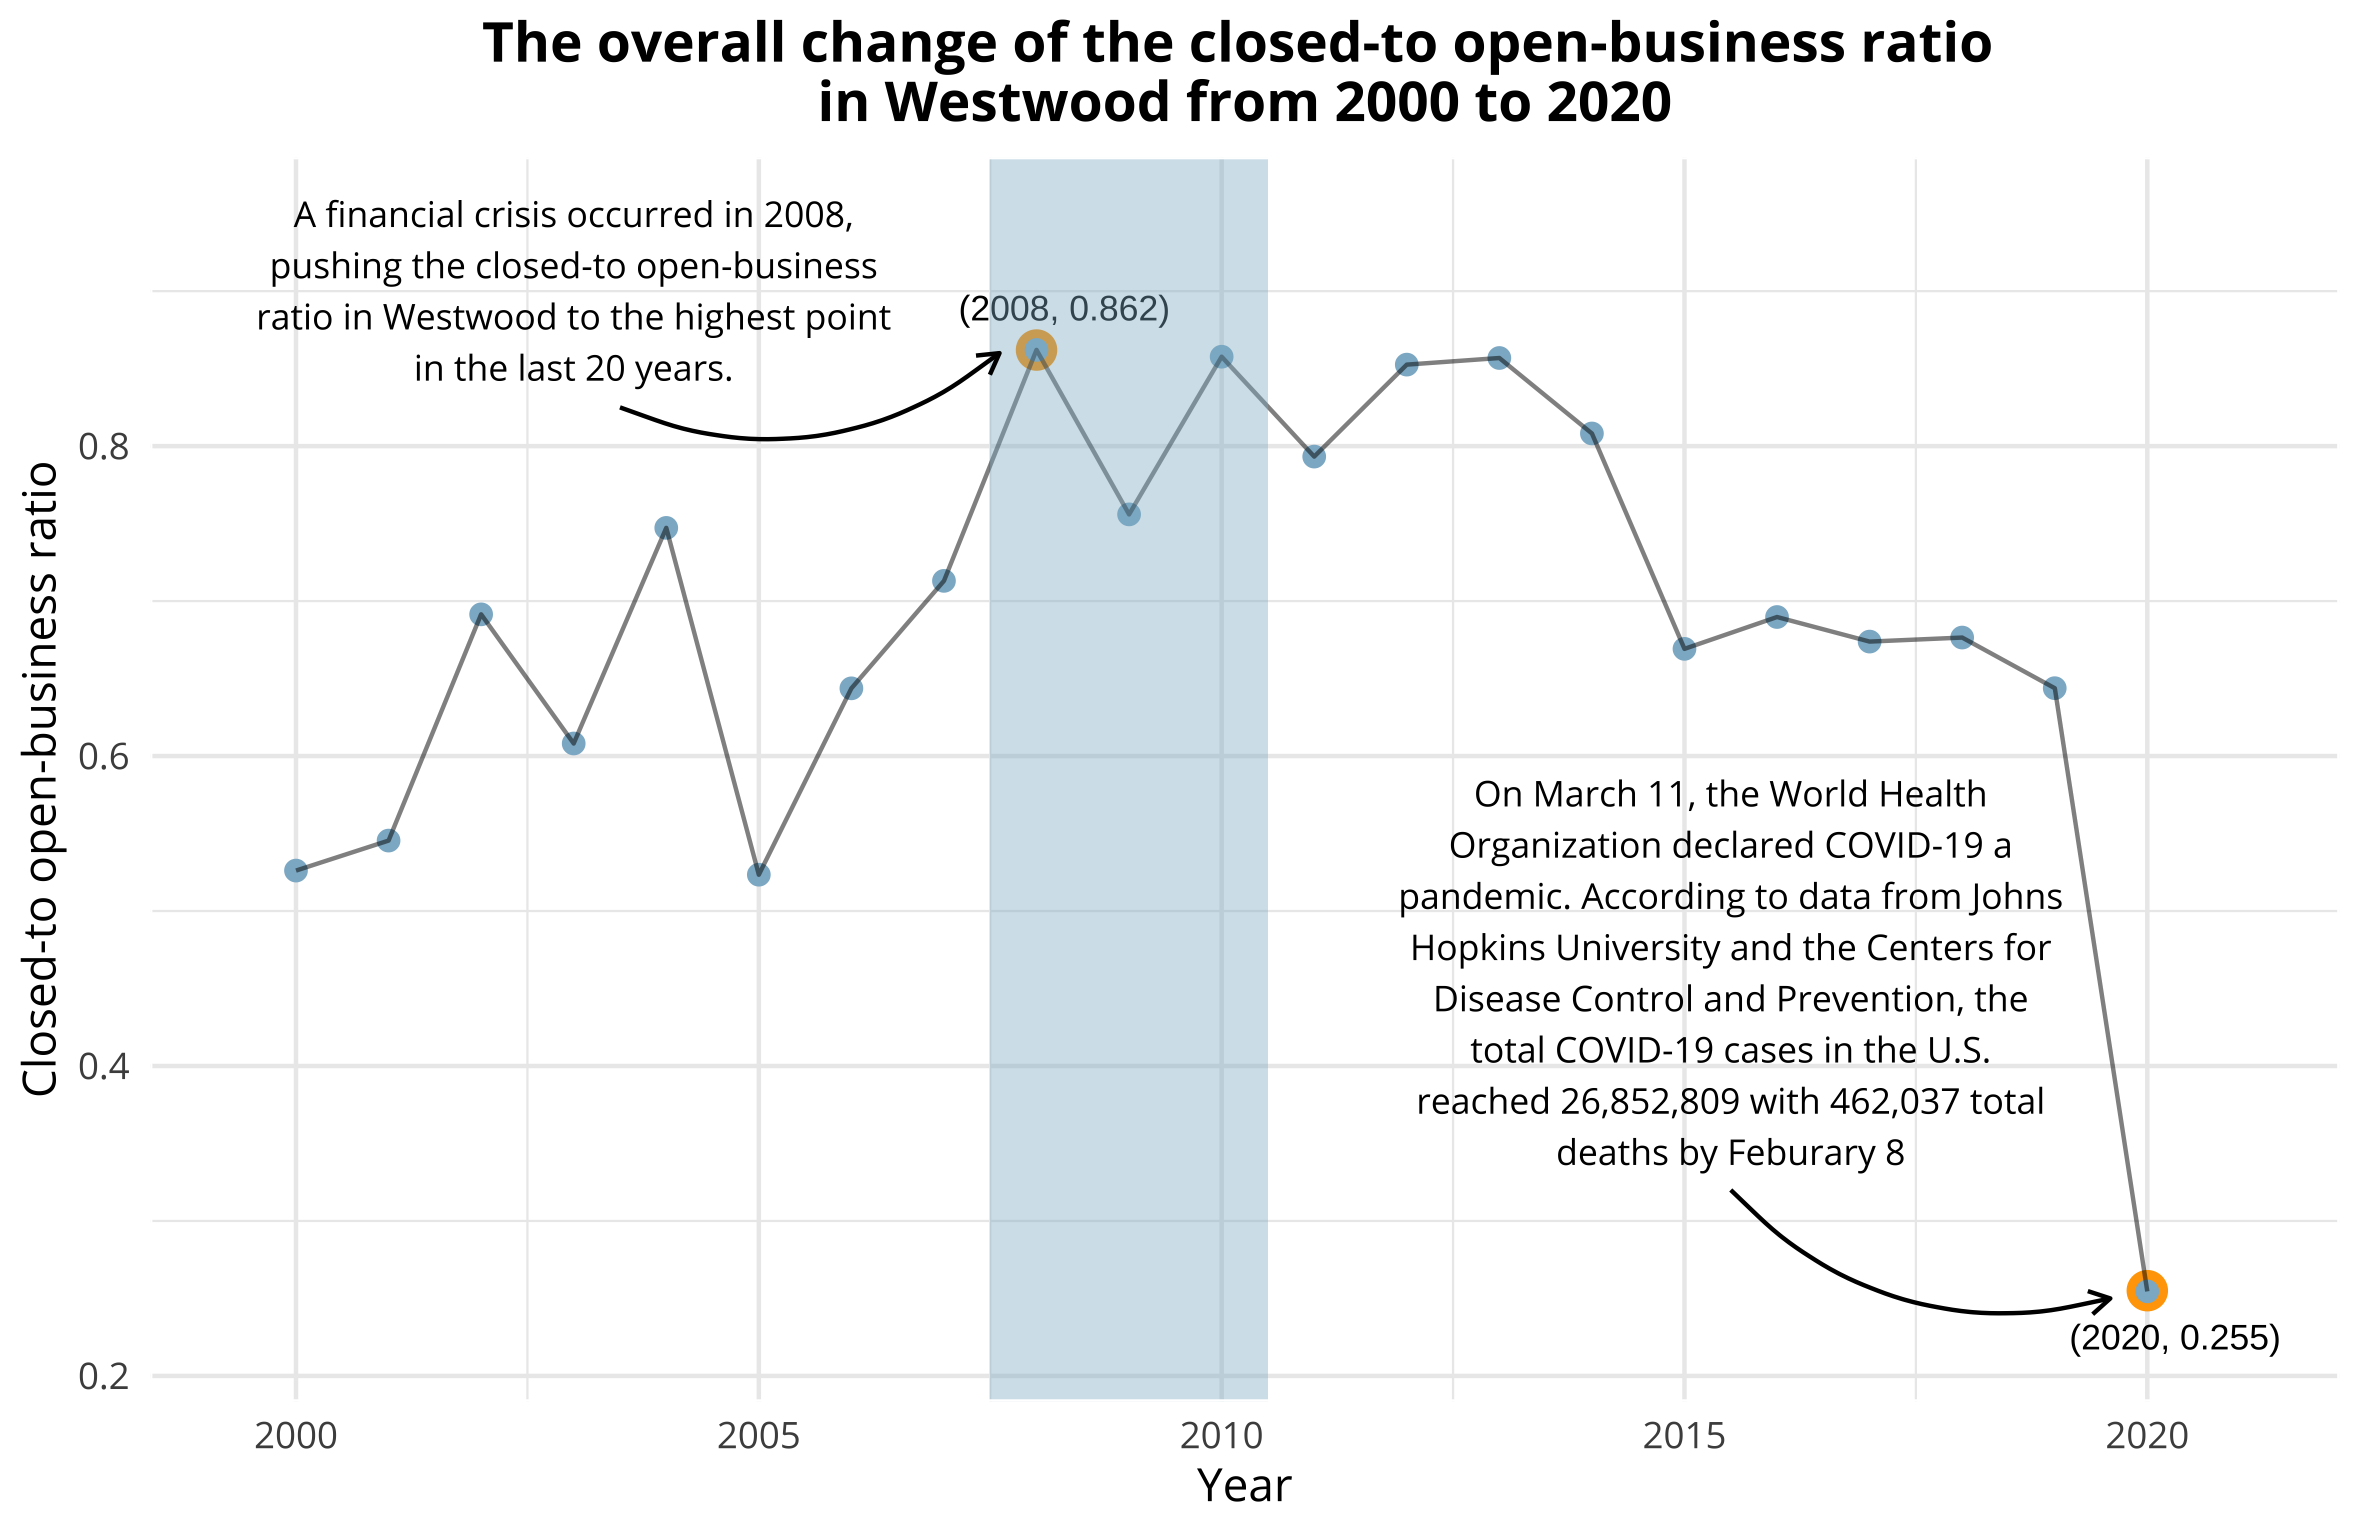
For further analysis, we dug deeper to explore Westwood business data from the past 20 years. Here, we used the closed- to open-business ratio (ratio between the total number of businesses closed and opened in a specific year) to reflect the well-being of Westwood businesses. The higher the ratio is, the worse off the businesses will in general be. From the graph below, we see that the ratio was highest during 2008 with a value of 0.86. However, the ratio of 2020 was 0.255, which is the lowest of the past 20 years. Using our ratio, we concluded that the Westwood businesses were not hit as bad as they were during the 2008 crisis.
However, Thomas said he saw the percentage of vacancies go up in 2020.
“About 31% of our ground floor retail spaces are vacant now,” Thomas said, compared to 22% the year before. The difference in the trends between the closed- to open-business ratio and the rate of vacancy may have resulted from the fact that the data we used includes all businesses in Westwood, including independent businesses and those in UCLA, while the data from the association only includes retail spaces in its estimation.
According to Flores, Sharetea has learned to adopt many new procedures to bring back its sales while ensuring the safety of its workers and customers.
“We decided to stay open throughout the whole process,” he said. “But what we did was adjust.”
These adjustments included implementing safety precautions such as requiring employees to wear gloves and record their temperatures before their shifts, he said. Along with the in-person precautions, the store, like many others, began performing deliveries for customers, which has allowed its sales to slowly pick up since the initial fall.
Conclusion
Although fewer businesses closed compared to previous years, our analysis shows that the number of new businesses also decreased in 2020 because of the increasing difficulty of maintaining normal business activities during the COVID-19 pandemic. The decrease in both the number of closing and opening of stores suggests that business activity in Westwood has slowed down overall.
At the same time, by studying the ratio between closed and opened businesses, we find that the ratio in 2020 drops to the lowest point in the past 20 years, meaning the negative impact of the COVID-19 pandemic on Westwood businesses is less serious than that brought by the financial crisis of 2008, even though the vacancy rate of retail spaces in Westwood increased. This insight could suggest that people turned to opening independent businesses where they can work in a more flexible environment instead of opening physical stores as the pandemic continued. Another insight from our study is that newer businesses (opened after 2015) are more vulnerable to the impacts of the COVID-19 pandemic than older businesses.
AUTHORS
Cameron Bian
Stack Developer
Cameron Bian was a math of computation student. He enjoys basketball, video games and watching comics.
Eustina Kim
Stack Developer
Eustina Kim was a statistics student, who also minored in digital humanities.
Ziqing Luo
Stack Developer
Ziqing Luo was an applied math and statistics student who is passionate about dancing and enjoys eating desserts.
Faye Zou
Stack Developer
Faye was a cognitive science student. During her spare time, she likes going to the gym and playing with her puppies.
Xuxin Zhang
Stack Developer and Photo staff
Xuxin was an applied mathematics and statistics student. He loves collecting vintage film cameras and taking photos for strangers.
 </div>
We labeled the businesses first opened before Jan. 1, 2015, as old businesses and those opened after this date as new businesses. We calculated the ratio between the number of closed businesses in 2020 and the number of currently active businesses for both old and new businesses. This ratio is used to reflect the vulnerability of old and new businesses to the economic impacts of the pandemic – the lower the ratio is, the more resistant the business is to the impacts of the COVID-19 pandemic. The result shows that the ratio for new businesses is 0.01143 (23 closed, 2,012 active), which is almost double the value of 0.005097 (19 closed, 3,729 active) for old businesses. Thus, we conclude that the new businesses are more susceptible to the effects of the COVID-19 pandemic.
</div>
We labeled the businesses first opened before Jan. 1, 2015, as old businesses and those opened after this date as new businesses. We calculated the ratio between the number of closed businesses in 2020 and the number of currently active businesses for both old and new businesses. This ratio is used to reflect the vulnerability of old and new businesses to the economic impacts of the pandemic – the lower the ratio is, the more resistant the business is to the impacts of the COVID-19 pandemic. The result shows that the ratio for new businesses is 0.01143 (23 closed, 2,012 active), which is almost double the value of 0.005097 (19 closed, 3,729 active) for old businesses. Thus, we conclude that the new businesses are more susceptible to the effects of the COVID-19 pandemic.