This post was updated May 20 at 11:43 a.m. to reflect clarified interpretation of the information considering null values and incomplete data.
Brantly Fulton grew up in Pontiac, Michigan, an underprivileged community outside Detroit.
Fulton went on to graduate with a degree in chemistry from Morehouse College and joined UCLA as a lecturer of chemistry in 2019.
Still, he said his path was difficult – he didn’t have any role models.
“I didn’t have professors that lived in my neighborhood,” he said. “You don’t have a symbol of that person who looks like you represent you.”
Fulton said African American students have told him they feel more comfortable coming to his lectures, coming to his office hours and paying attention in class because they can identify with him.
Fulton said although there is great diversity among undergraduate and graduate students, there is very little among faculty, adding he thinks institutions have to do better jobs seeking out talented individuals from underrepresented backgrounds. Since 2010, there has never been more than two fully employed African American faculty in the Chemistry/Biochemistry department, where Fulton works.
“Because it is so competitive to get into academia, it allows for institutions to sit back and just allow for applicants to apply,” he said. “Institutions need to be more proactive and attend minority based conferences and go out into these communities to kind of seek out the talents.”
The Stack took a look into faculty hiring patterns based on race and gender over the past 10 years, starting from the 2010-2011 through the 2018-2019 academic year.
About the Data
The data was collected from BruinX, an analytics-based think tank housed under the Office of Equity, Diversity and Inclusion at UCLA.
The number of faculty per school/department is shown as full-time equivalent – an employee who works full time year round would equal 1 FTE, while an employee who works half time for a full year would equal 0.5 FTE.
Departments that do not teach undergraduate courses and have less than 5 FTE faculty are not shown, though they are included in broader school counts. Additionally, departments that have limited data on the BruinX website are not included in any of the department-specific graphs. A full list of unincluded departments is provided under the “Conclusion” section.
Some fields in the data provided by BruinX contain null values. These values are treated as 0.0 in our graphs.
Correction: The original version of these graphs displayed FTE data under incorrect department names. The original version also incorrectly displayed data that factored in incomplete information of certain demographic groups within certain departments, which BruinX did not provide. Those departments have been removed.
Sort by
Race/Ethnicity by School
Race/Ethnicity by Department
General Observations
In general, women are underrepresented compared to men – campuswide, 61% of the UCLA faculty were male in the 2018-2019 school year. Men are most highly represented in the Henry Samueli School of Engineering and Applied Science, the Anderson School of Management and in the physical sciences. Women are most highly represented in the School of Nursing, the Graduate School of Education and Information Studies and the Fielding School of Public Health.
What has UCLA done in the past 10 years?
Efforts to improve diversity within the faculty have largely been spearheaded by the Office of Equity, Diversity and Inclusion.
UCLA founded the Office of EDI in 2015 in response to the Moreno Report – an internal investigation which found the university’s response to incidents of bias and discrimination “inadequate.”
Since then, the office has attempted to improve UCLA’s response to bias and discrimination, including by publicizing resources aimed to encourage sensitivity and releasing accountability reports to publicize statistics of complaints and investigations on campus.
The Office of EDI also created BruinX, a campus think tank that aims to apply data analytics toward diversity-related issues.
Chukwuebuka Nweke, a postdoctoral researcher in civil and environmental engineering, said there has been a lot of effort to hire minority faculty – which includes African American, Chicana(o)/Latina(o)/Hispanic, LGBTQ+ and female candidates.
Nweke added that minorities are put in the same pool when it comes to searching for minority candidates, which reduces the efficacy of these initiatives.
“It’s almost like they compete against each other,” he said. “(It) becomes a crabs-in-a-bucket type situation.”
In the end, however, the faculty chooses the best candidate regardless of race, he added. The process brings out the best minority candidates and lets them compete with the otherwise best candidates, he said.
“A lot of complaints before was that, ‘Oh we can’t find these people,’” he said. “Now, what a lot of schools do is, ‘OK, now you have to find them.’”
Unequal Departments
The graph below shows the departments with the highest percentages of a particular race/cultural group.
Cultural fields of study often had high proportions of that culture as faculty. The Asian Languages & Cultures Department, for example, had a majority of Asian faculty through the nine years we measured. Similarly, the Chicana/o studies and Spanish and Portuguese departments had high levels of Chicana(o)/Latina(o)/Hispanic faculty.
It’s also worth noting that some departments had no professors of some ethnic groups – the data showed that almost every year, there were at least 20 departments that had no Asian professors, African American professors, Chicana(o)/Latina(o)/Hispanic professors or American Indian professors, while there were rarely more than four departments with no white professors.
Correction: The original version of these graphs incorrectly displayed data that factored in incomplete information of certain demographic groups within certain departments, which BruinX did not provide. Those departments have been removed.
Upticks in Faculty Diversity
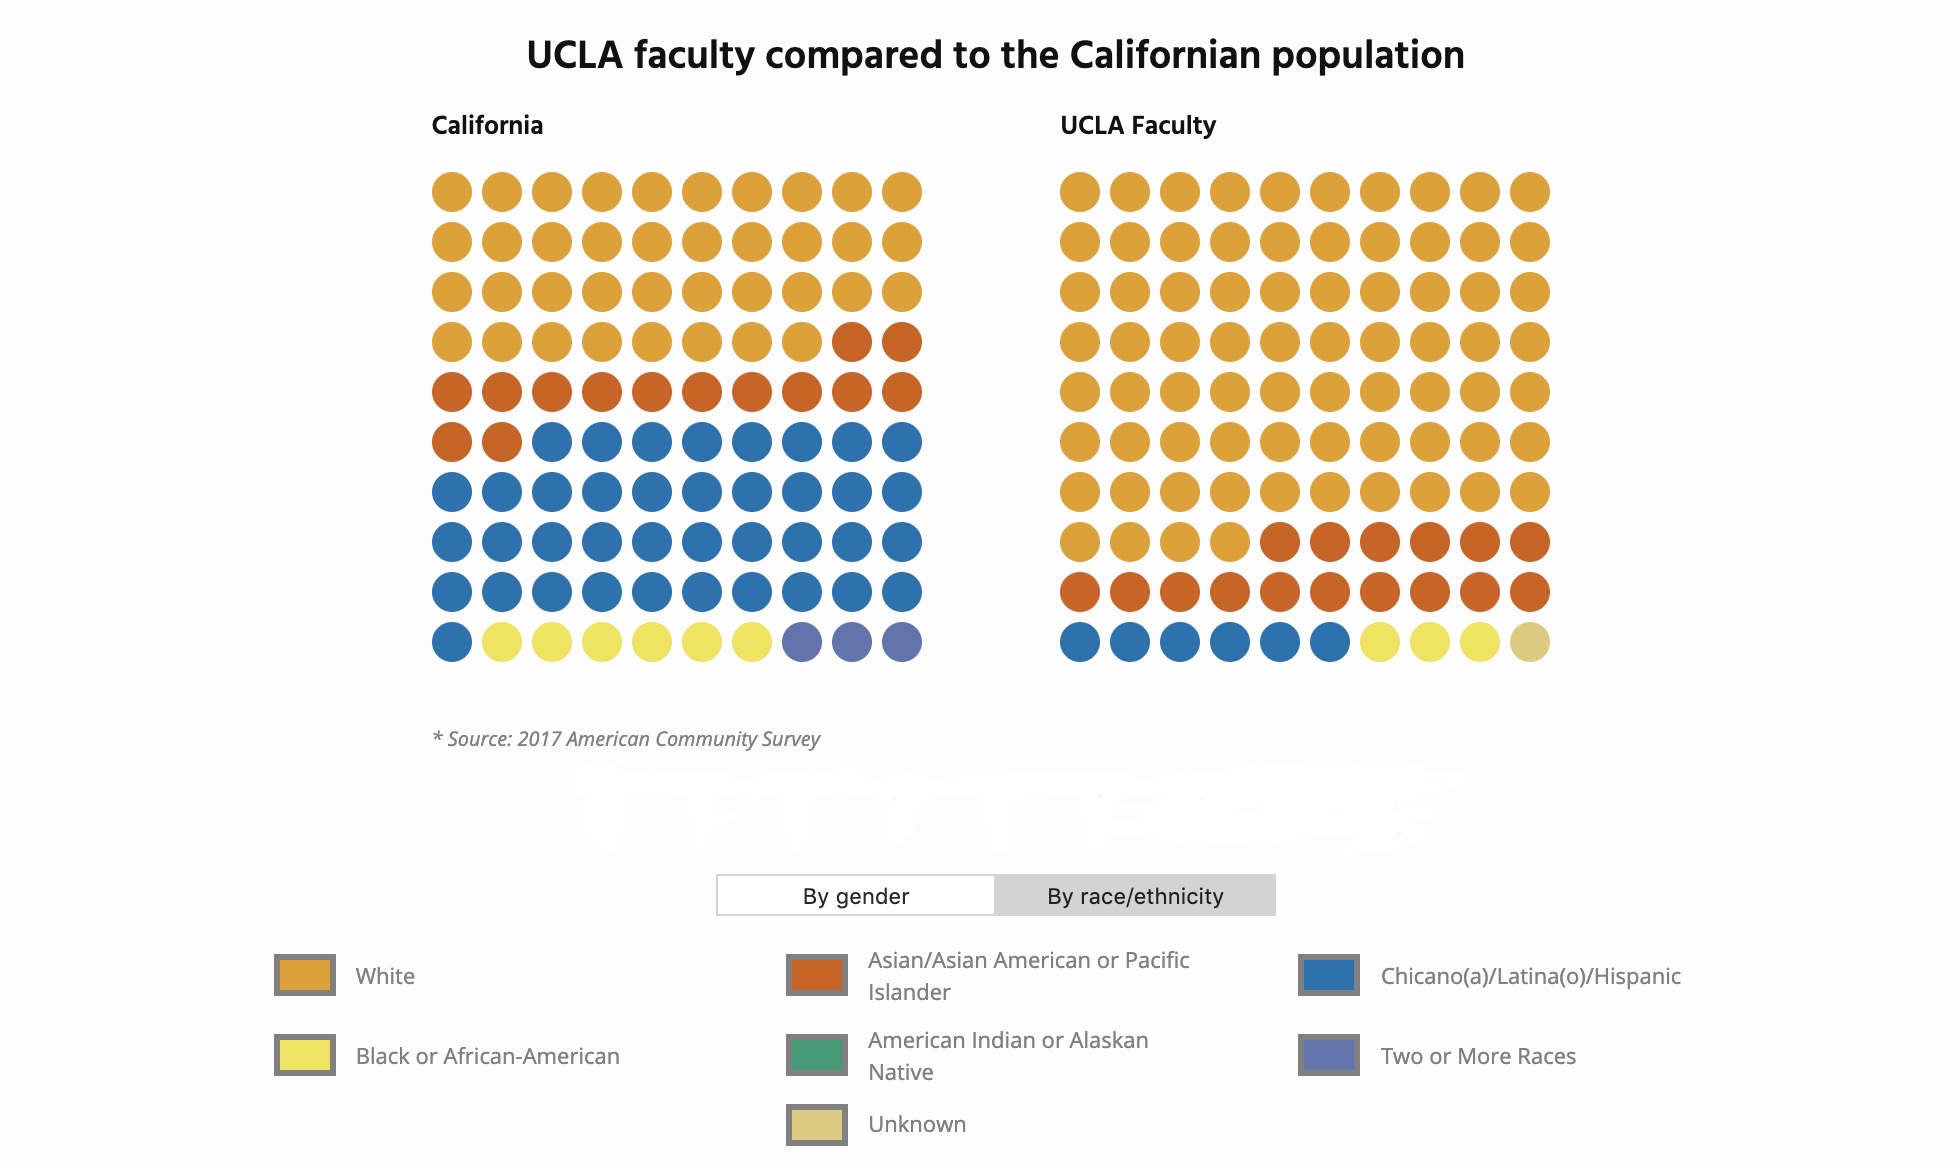
UCLA faculty is less diverse than the California population – however, this has changed from 2010-2018. The proportion of white faculty decreased by nearly 10%, whereas the proportion of minority faculty, including Chicana(o)/Latina(o)/Hispanic and African American faculty, increased by nearly 3%.
Interestingly, the proportion of faculty who declined to note their race or ethnicity increased by nearly 400%.
The proportion of female faculty has also increased by around 5%.
Groups that make up less than 0.5% of the California or UCLA population do not appear on the chart, as each dot represents a full percent of the population. Any percentages that were not whole were rounded to a full percentage.
UCLA faculty compared to the Californian population
California
* Source: United States Census
UCLA Faculty
201020112012201320142015201620172018
White
Asian/Asian American/Pacific Islander
Chicano(a)/Latina(o)/Hispanic
Black or African-American
American Indian or Alaskan Native
Two or More Races
Unknown
Female
Male
GHOST BLANK
GHOST BLANK
GHOST BLANK
GHOST BLANK
GHOST BLANK
In the table below, we show the five schools with the largest change in proportion per minority group from 2010-2018.
Few schools had a significant (>10%) percent change in American Indian faculty.
The School of Law was within the top five biggest increases in each of the minority faculty present, raising the percentage of Chicana(o)/Latina(o)/Hispanic and African American faculty by approximately 30% and 20%, respectively.
Conclusion
UCLA has, in general, increased the proportion of minority faculty.
Nweke said he thinks universities should focus on pipelining students from the high school and undergraduate level toward the graduate and professor level, since the pathway is a funnel between each level. Still, UCLA is on the right track he said, adding he hopes people don’t forget the importance of diversity.
“My biggest fear is that (diversity is) in fact a buzzword, and that people will forget about it in a couple of years,” Nweke said. “But from what I’m seeing, … I don’t think that that’s the case.”
Unincluded Departments
The following departments were removed from department-specific graphs due to the fact that they do not teach undergraduate courses and have fewer than 5 FTE faculty, or if they have incomplete data on the BruinX website.
American Indian Studies, Archaeology, CA Cntr for Population Research, Center for Jewish Studies, Chicano Studies Research Cntr, Dean Division of Humanities, Dean GSE&IS, Dean HASOM, Dean STFT, Dental Clinic, Dental Clinic Off Campus, Dental Research Inst, Dechenne Musc Dyst Research Cntr, Educational Initiatives, Film & TV Archive, Fowler Museum, Honors Program, Inst for Planets & Exoplanets, Inst for Pure & Applied Math, Inst for Res on Labor & Employment, Inst for Technology Advancement, Institute for Archaeology, Interdepartmental Degree Programs, Interdepartmental Program - Social Sciences, Lesbian, Gay & Bisexual Studies, Life Sciences Core Crclm Prgm, Luskin Center for Innovation, Minor in Biomedical Research, Nasarian Center for Israel Studies, Neuroscience Interdepartmental Program, Program in Computing, Study of Religion, Writing.
AUTHORS
Bernard Mendez
News Editor
Bernard was the Bruin’s News Editor. In his free time, Bernard spent time as a math student at UCLA.
Annie Zhang
Stack Developer
Annie was a math student who really enjoys heist novels, murder mystery TV shows, noodles and setting unrealistic goals.
Charlotte Huang
Stack Developer
Charlotte was an applied math and cognitive science student. Outside of math and data, she enjoys reading, watching K-Drama and listening to K-Pop.
Jeanette Lin
Stack Developer
Lin was a statistics student. Outside of school and data analysis projects, she loves hiking, going to the beach and drinking boba.
Juan C. Rios
Stack Developer
Rios was a computer engineering student who enjoys programming and music.