Have you wondered why you always seem to have lectures at 8 a.m every
morning in Broad Art Center or Bunche Hall while your roommates get to sleep in
until noon? It turns out there are patterns that determine when and where departments schedule their classes. The class schedules we used were scraped from the UCLA Registrar archives and included all classes held between Fall 2012 to Winter 2017.
Where are the classes located for my department?
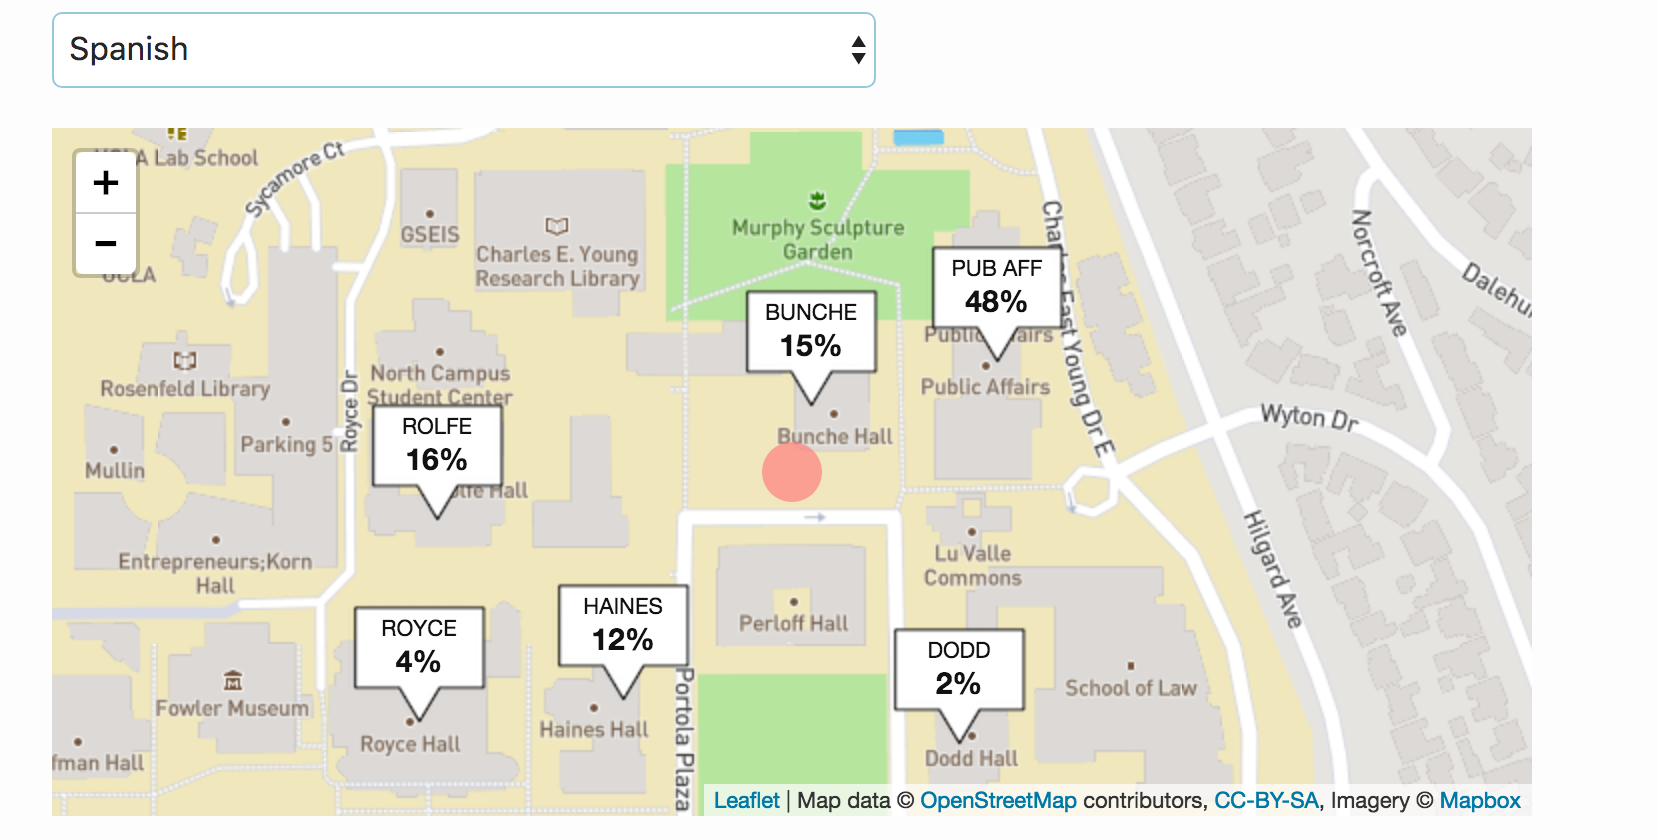
Pick a department to see the geographic distribution of that department’s classes.
Each box displays the percent of classes that are held in the corresponding building, and you can click on it to see a more detailed breakdown, including a number that takes class size into account. (Note: Buildings that account for less than 1 percent of the total are excluded.)
The red circle indicates the weighed average location for that particular department.
Some departments, like Design | Media Arts have almost all of their classes concentrated in one building, while others like the statistics department resembles a diaspora that has no particular buildings to call home. (More on this later in the post.)
The GE cluster classes in particular have a weighted center in the middle of “nowhere,” as around half of them are on the Hill and the other half are on campus.
How spread out are departments?
Some departments hold lectures in many buildings scattered around campus while others are concentrated in two or three buildings. For each department, we calculated the percent of classes that took place in its three most common buildings. This type of analysis is sometimes used by economists to detect whether an industry is monopolized by a few companies.
Most Concentrated Departments
Department
Top 3 Percent
Dance
100%
Ethnomusicology
100%
Music
100%
Music History
100%
Art
99%
Arts and Architecture
99%
Nursing
99%
Physics
98%
Biostatistics
97%
Astronomy
96%
Design / Media Arts
96%
Art History
95%
Materials Science and Engineering
95%
World Arts and Cultures
95%
Chemistry and Biochemistry
93%
Film and Television
92%
Program in Computing
89%
Education
88%
Anthropology
87%
Classics
86%
Departments Without Homes
Department
Top 3 Percent
Molecular, Cell, and Developmental Biology
39%
Statistics
41%
Environment
41%
Microbiology, Immunology, and Molecular Genetics
45%
Gender Studies
46%
Religion, Study of
49%
Ancient Near East
49%
Honors Collegium
51%
Asian American Studies
53%
Society and Genetics
54%
Physiological Science
54%
Neuroscience
55%
Chicana and Chicano Studies
56%
English
58%
Linguistics
60%
Global Health
60%
Ecology and Evolutionary Biology
60%
Communication Studies
61%
Scandinavian
62%
Japanese
63%
History
63%
How North or South Campus is my department?
Using the latitude (ie. vertical) values of each department’s center, we can now rank departments based on how North or South Campus they are. We also convert the latitudes into distances from Bruin Walk (in meters), which we use as a dividing line.
Note: In case you’re wondering why your favorite department isn’t on the list, we included only the 40 largest departments (by number of students) in the following tables.
Most South Campus Departments
Department
Distance from Bruin Walk (m)
Life Sciences
-320
Ecology and Evolutionary Biology
-309
Physiological Science
-276
Chemistry and Biochemistry
-265
Neuroscience
-254
Microbiology, Immunology, and Molecular Genetics
-231
Engineering
-165
Electrical Engineering
-142
Mathematics
-131
Computer Science
-131
Psychology
-98
Environment
-76
Statistics
-53
Physics
-42
Ethnomusicology
-31
Education
-31
Music
-31
Music History
-31
Bruin Walk
0
Most North Campus Departments
Department
Distance from Bruin Walk (m)
Film and Television
536
Theater
503
Economics
325
Spanish
325
Geography
302
Political Science
269
Management
258
History
258
Chicana and Chicano Studies
258
Communication Studies
247
French
236
Philosophy
225
Sociology
225
Chinese
225
Anthropology
213
Classics
202
Linguistics
191
English Composition
191
Art History
191
General Education Clusters
191
English
158
Bruin Walk
0
As we can see, related departments tend to be clustered together geographically. The furthest South Campus
departments are in the biological sciences, followed by engineering and then the other sciences.
Interestingly enough, the music department is slightly on the South Campus side because
of the location of Schoenberg Music Building. Furthest north are
the visual and performing arts, followed by social sciences and finally, the language departments.
When are the classes for my department held?
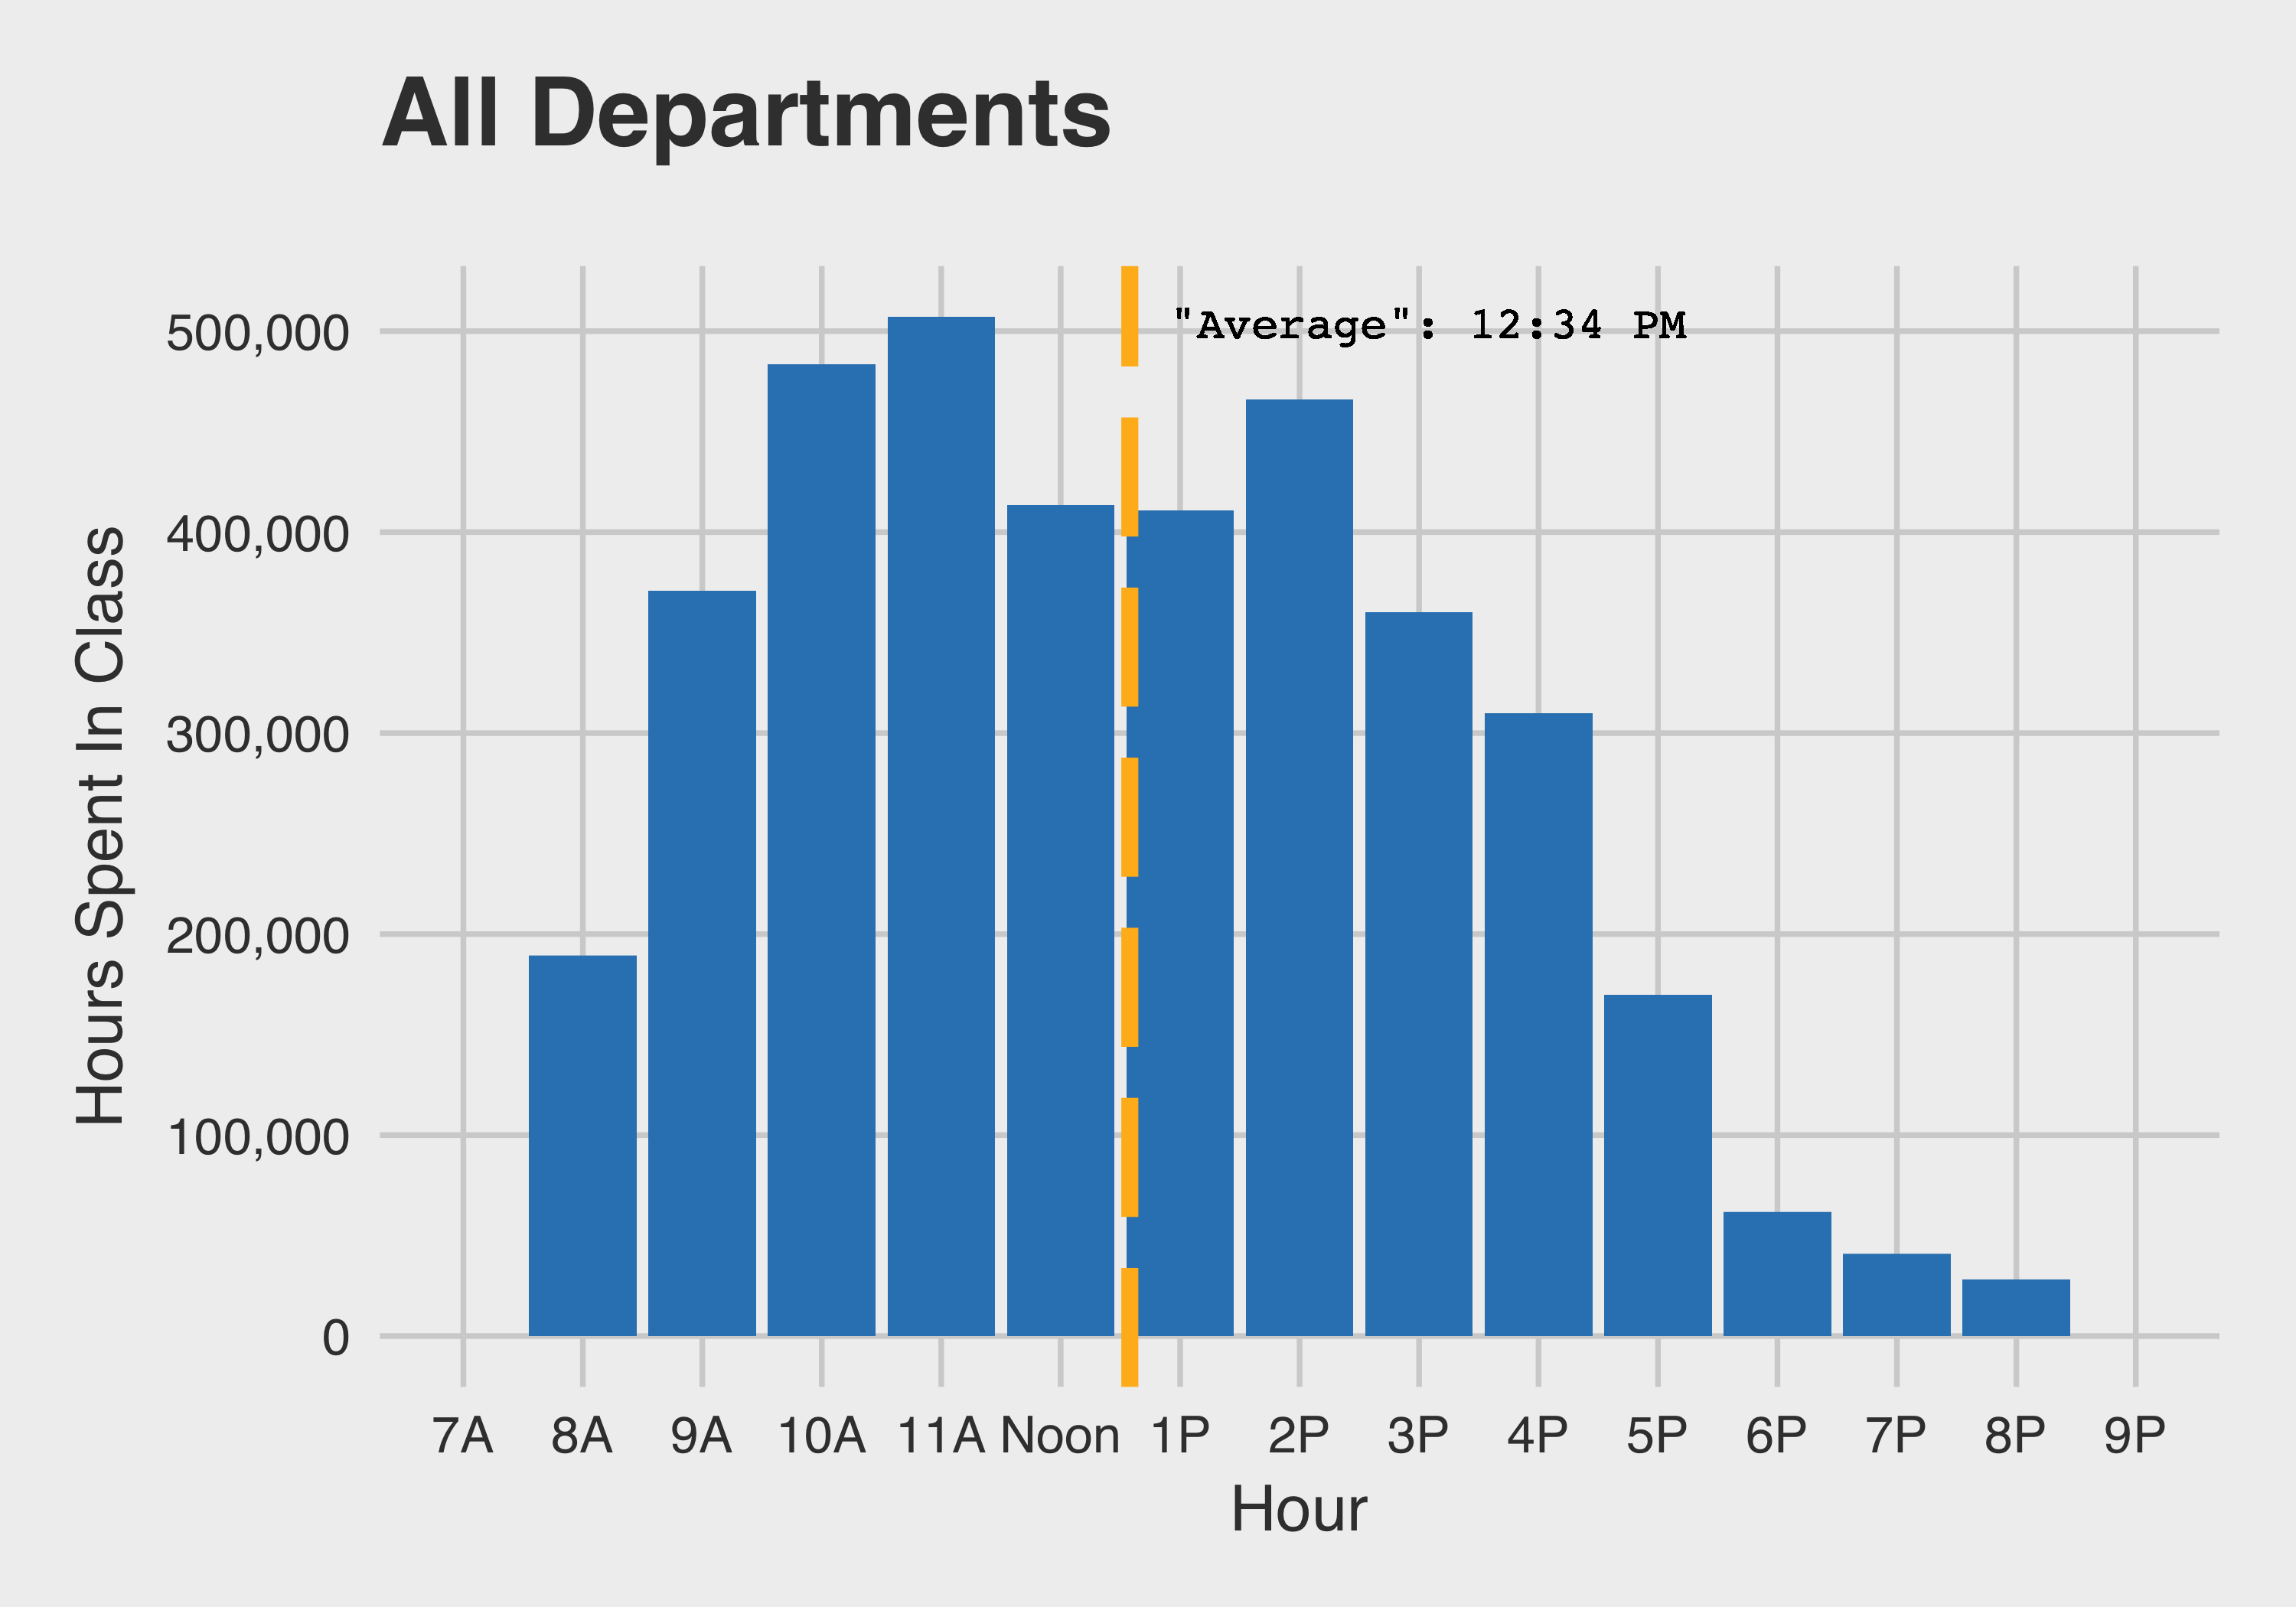
Scheduling patterns are also evident in when classes are held. Let’s take a look at how many student-hours in total are spent in each hour period. (For example, if 100 students are in a class that lasts 30 minutes, then 50 student-hours are counted.) The “average” time is also labeled and it provides a rough summary of each distribution.
Pick a department to see its hourly distribution.
A few interesting patterns:
Some departments with earliest class times include: Music History, Program in Computing, Chemistry and Biochemistry, Spanish, Mathematics, and Life Sciences.
Some departments with latest class times include: Communication Studies, Film and Television, Chemical Engineering, Management, Political Science, and Gender Studies.
AUTHORS
Jerry Li
Stack Developer
Jerry was a computer science student who transforms food into code. When not hacking away or getting lost in data, he likes to play badminton, fold origami and play board games.
Tyson Ni
Data Viz Apprentice
Tyson likes telling stories with data. Feel free to send him feedback, data, or story ideas.