Well-chosen general education classes can be great GPA boosters.
The latest Bruinwalk data offers an unprecedented look at letter-grade distributions of every class taught at UCLA between fall 2012 and fall 2015.
It’s also a great guide for choosing easy GE courses.
There are many ways to measure the difficulty of a GE class aside from grades – difficulty of content, workload and frequency of assessments, among other qualities.
In this post, we’ll use the percentage of students who got an A+, A or A- in a given class as our metric. While it does not depict complete grade distributions, the metric is the most intuitive one for students who want to choose GE classes that can boost their GPAs.
A’s boost grades. B’s and C’s? Not so much.
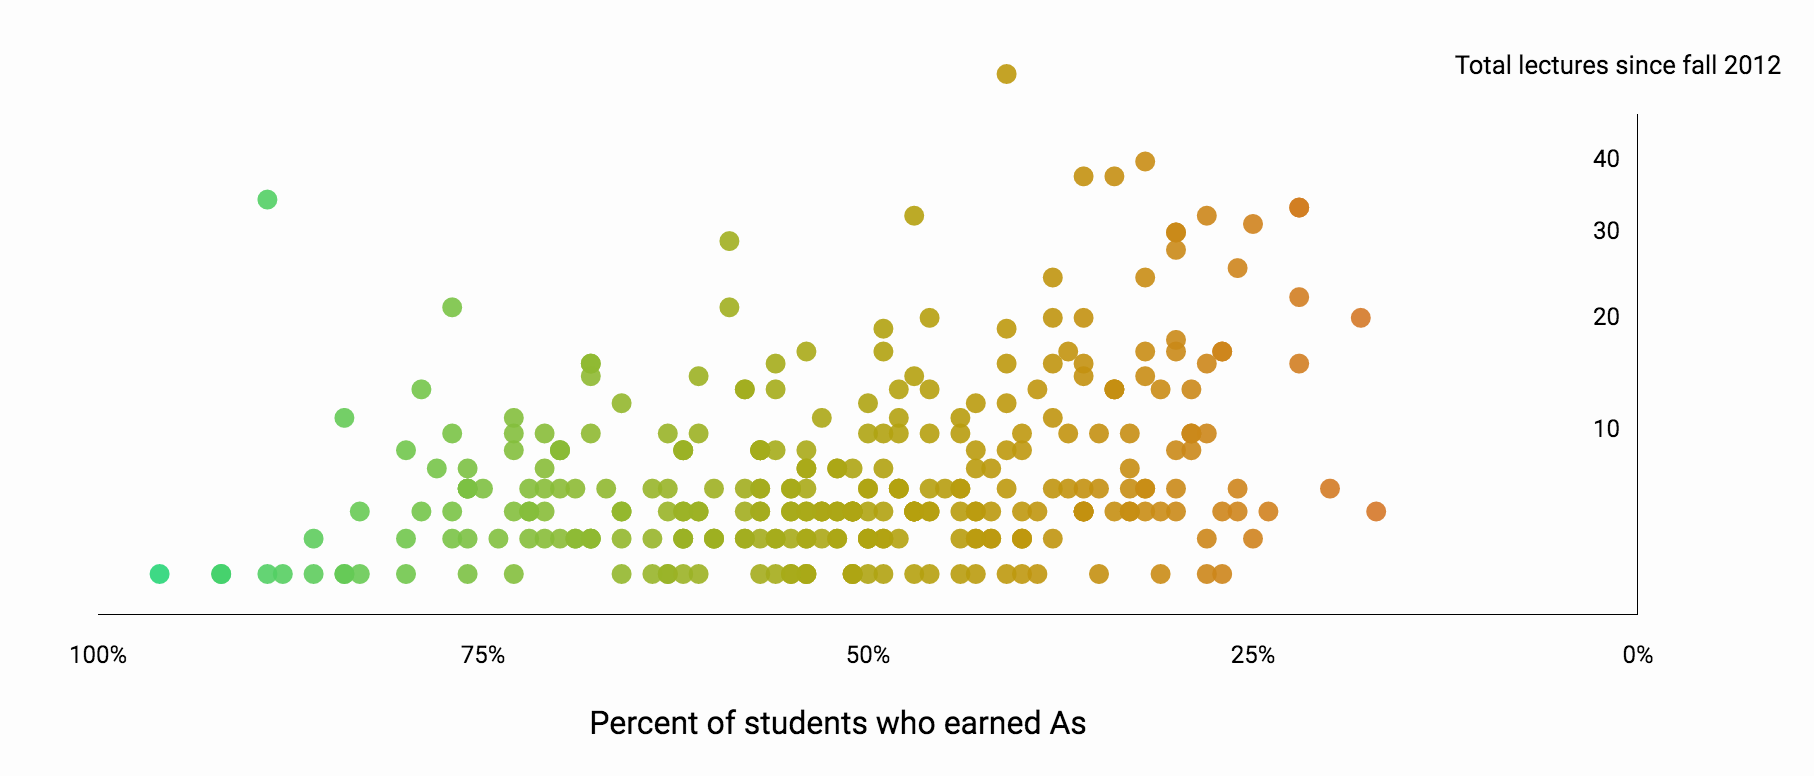
A bird’s-eye view of all GEs
In the following scatterplot, the x-axis shows the median percentage of students who earned A’s across different sections of a class. The y-axis shows the number of times the class was taught between fall 2012 and fall 2015.
A "frequently taught" class is one that has been offered at least five times since fall 2012. In an "easy" class, at least 60 percent of students earned A's. In a "hard" class, at most 30 percent of students earned A's. A "large" class had a median class size of at least 100 people, and a "small" class had a median class size of at most 40 people.
Why science GEs have the toughest curves
When we examined average class grade distributions for each GE requirement, we concluded science GEs have the toughest curves.
On average, only 30 percent of students who took a physical sciences GE course earned A’s. Life science GEs follow, with an average of 40 percent of students earning A’s.
Students were twice as likely to earn A’s in a typical visual and performance arts class than in a life sciences class.
Check out the chart below.
Why might this be the case? Most North Campus classes have more favorable grade distributions than South Campus ones, but there may be another explanation.
Many of the tougher science GEs are actually core classes many South Campus students are required to take – and many are known to be “weeder” classes.
Science GEs
Subject
CatalogNo
Name
PercentA
Fewer courses that fulfill social science or humanities GE requirements are prerequisite courses for North Campus students. Take a look at the literary and cultural GE courses listed below. It is less likely students enrolled in most of these GEs are competing to establish a strong GPA in curricula required by their major or in graduate school.
Literary and cultural GEs
Subject
CatalogNo
Name
PercentA
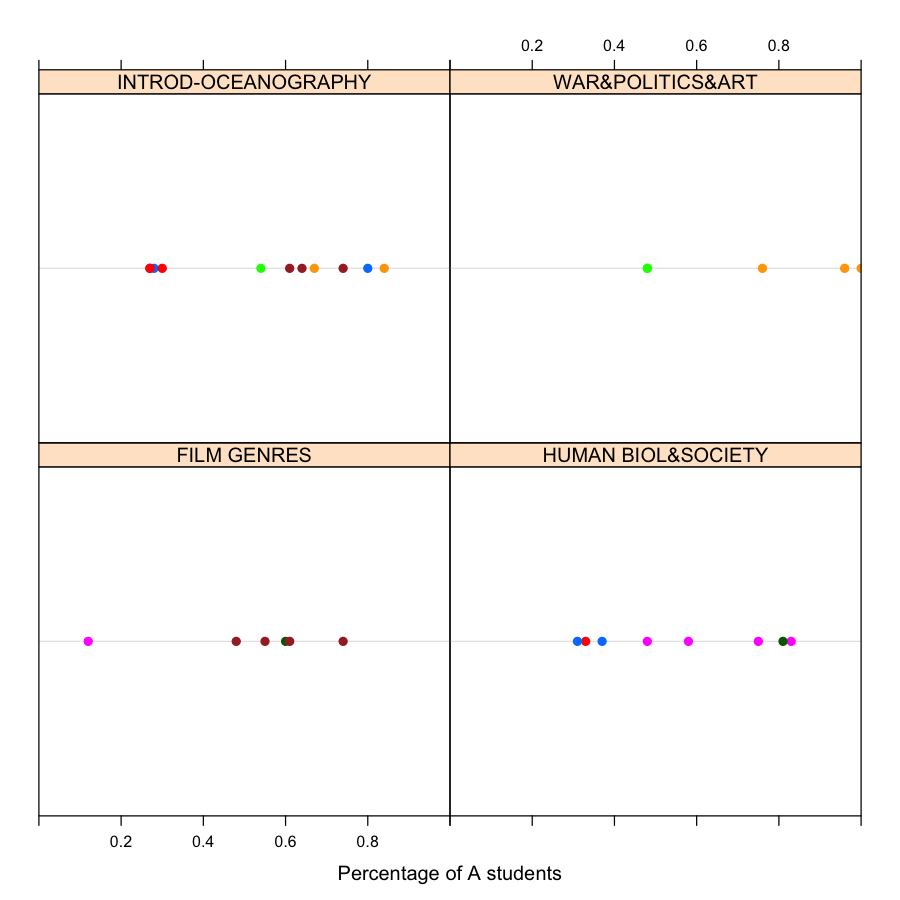
Some GEs have very inconsistent curves between lectures
Median statistics don’t quite capture how some professors grade differently between their lectures. An analysis of complete grade distributions revealed some professors graded very differently lecture to lecture.
Therefore, some well-known, easy GE courses may not be as easy as rumored. For example, median values suggest 76 percent of students who took German 102: “War, Politics, Art” earned A’s. But in two of the five lectures, less than half of the students earned A’s.
But which classes have inconsistent curves and require you to do more research?
Let’s look at four GEs that vary significantly, based on the median percentages of students who earned A’s.
These two graphs provide a sense of what grade variation looks like. Circles that are more spread apart indicate larger differences in the grade distributions. Each color represents a different professor, and circles of the same color that are spread apart suggests the professor may use a less predictable grading scheme.
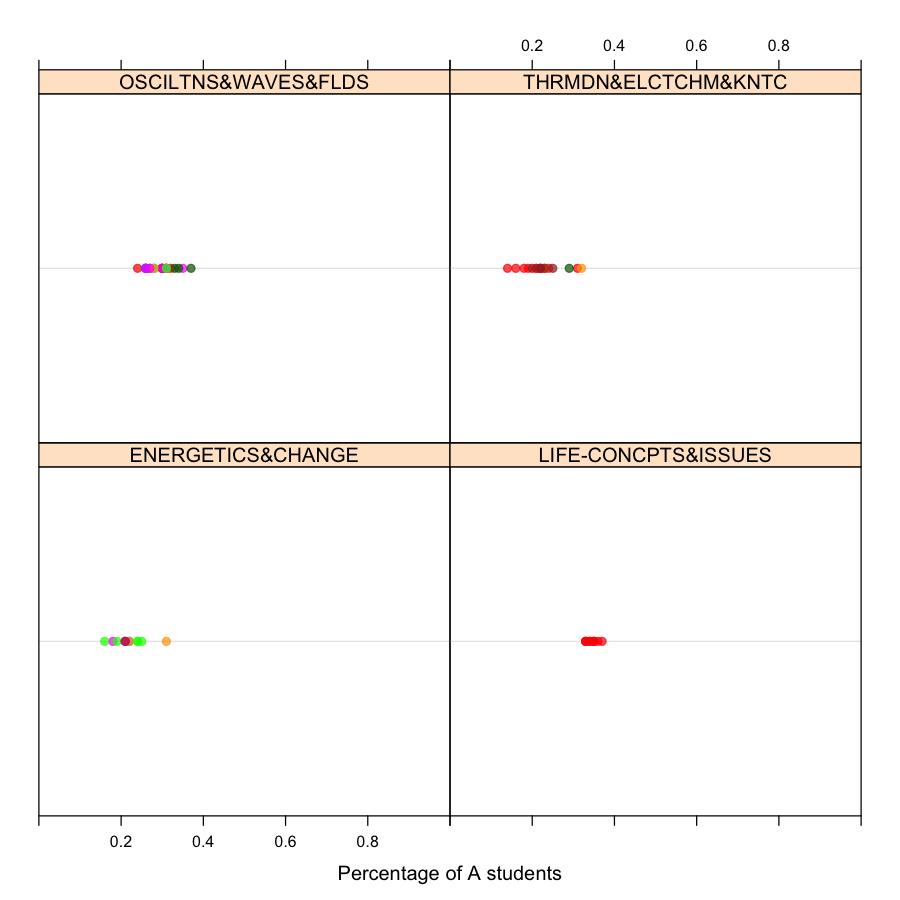
Four GEs that have the largest grade variations between lectures
Students who took Earth Planetary Sciences 15: “Intro to Oceanography” had between a 61 and 84 percent chance of earning an A. Unlucky students enrolled in lectures for which instructors awarded A’s to less than 30 percent of students.
At other end of the spectrum, students who took Life Sciences 15: “Concepts and Issues” across 10 different lectures over the last three years were graded on roughly the same curves. A third of students earned A’s in the toughest lecture, and 37 percent earned A’s in the easiest lecture – a much smaller variation.
Four GEs that had the smallest grade variation between lectures
We can conclude some professors may make conscious decisions to grade more consistently, and some core lower-division classes tend to have more consistent grade distributions.
In most cases, our data confirms it is important to choose the right lecture or quarter during which to take a class.
Curious about the curve consistency of a particular GE class you have in mind?
Use the searchable table below.
The table only includes classes that have been taught at least three times since fall 2012. The default table sorts courses from most to least standard deviation using the same metric, the number of A's, as above.
Look up any GE course
Looking for a specific class? Trying to find the perfect GE? Use the searchable table below.
The table only includes classes at least 50 students have taken since fall 2012.
Stay tuned for upcoming posts
In the coming weeks, we’ll continue to analyze grade distributions to answer more questions. Which professors are harder than their department average? Do smaller classes have more favorable curves than larger ones?
Have burning questions of your own? Email us or comment below!
About the data
The data used was obtained through a public records request submitted to the UCLA Registrar. It contains grade distributions for classes with more than 10 students from fall 2012 to fall 2015.
AUTHOR
Tyson Ni
Data Viz Apprentice
Tyson likes telling stories with data. Feel free to send him feedback, data, or story ideas.