The project was originally just a solution to provide our staff of more than 250 people easy, on-demand access to our user analytics.
We decided to go one step further and make it a tool to publicly display our analytics.
Why public?
We’ve always been a fan of open data at The Stack.
Open data allows interested parties – other student newsrooms, media organizations or readers – to learn from the data we publish.
We soon realized while building this tool that our user analytics data is just another dataset with information others could benefit from. After some thought, we decided the pros of making this data free and easy to access outweighed the few cons.
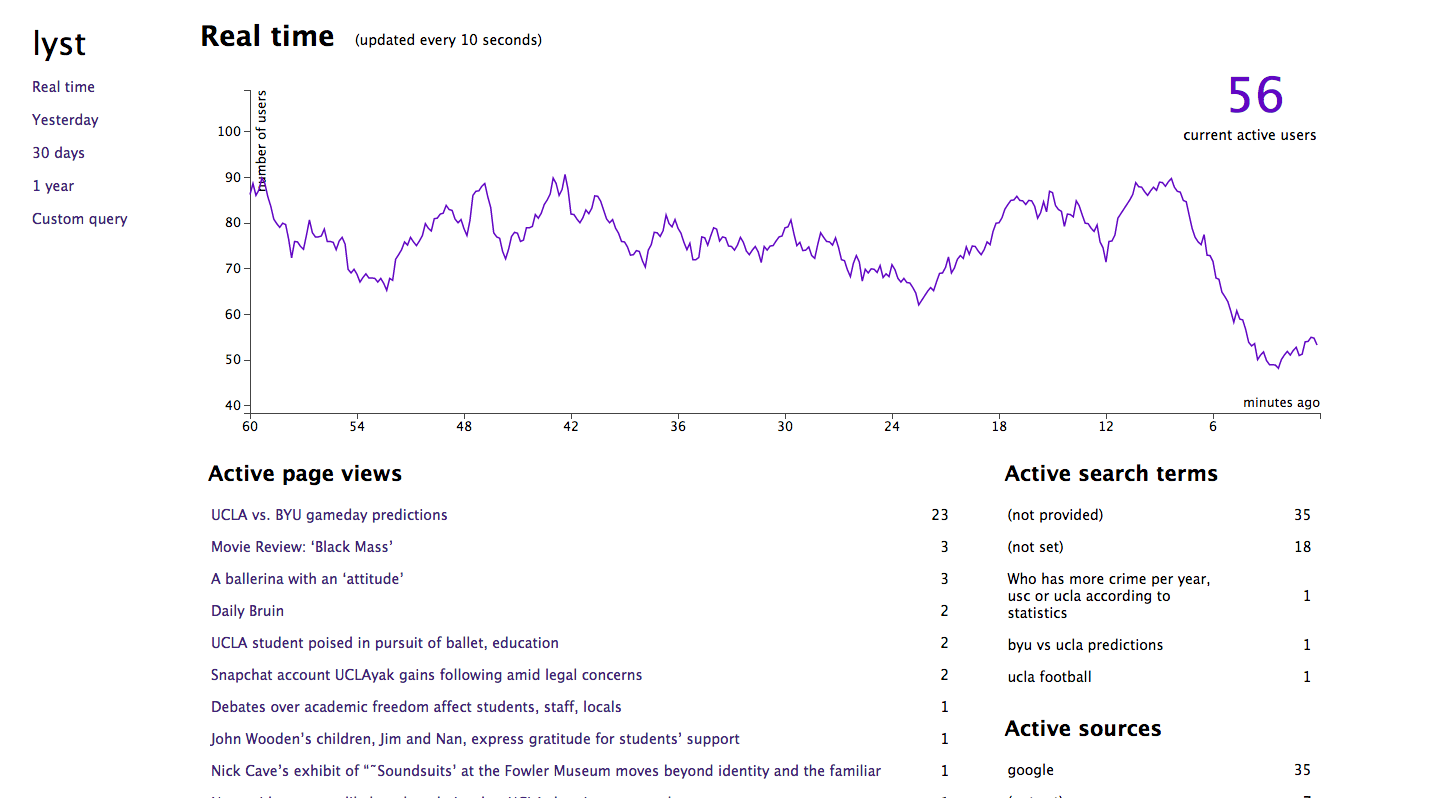
Lyst's home page shows real-time user sessions.
We also hope that, by making this data open, other newsrooms will follow suit – either by using lyst themselves or by creating a similar application.
Being one of the first newsrooms to publicly share its analytics is also exciting. BuzzFeed is the only newsroom we could find that is doing something similar.
We’re excited to join this experiment.
lyst in action
Four breaking news posts published throughout the day this Sunday. With lyst, we were able to see when readers visited the site and how they got there.
A 50 percent spike in analytics occurred before the first two posts about an apartment fire in Westwood even went online. People had heard about the incident from other sources, searched Google, and were ending up on old Daily Bruin articles about past fires.
When the first post about the fire published, it generated a 500 percent increase in traffic. The second post then doubled that traffic for a total increase of 10 times the average for that time of day.
We saw that the Daily Bruin Facebook account was our most effective social media account for getting the news to our readers, and that despite high traffic from social media, a majority of readers were getting to us via Google.
How does lyst work?
Google Analytics itself is great platform and, since it’s free, it automatically becomes the preferred tool for a small student newsroom like the Daily Bruin.
But free also means the tool comes with some limitations.
There is no easy way to share on-demand analytics with a large group of people since the dashboard requires admin access for each individual person. The closest solution Google provides in the dashboard is a reporting feature that can email PDF reports on a scheduled time interval.
We built lyst as a solution that interacts with all the data Google gathers for us.
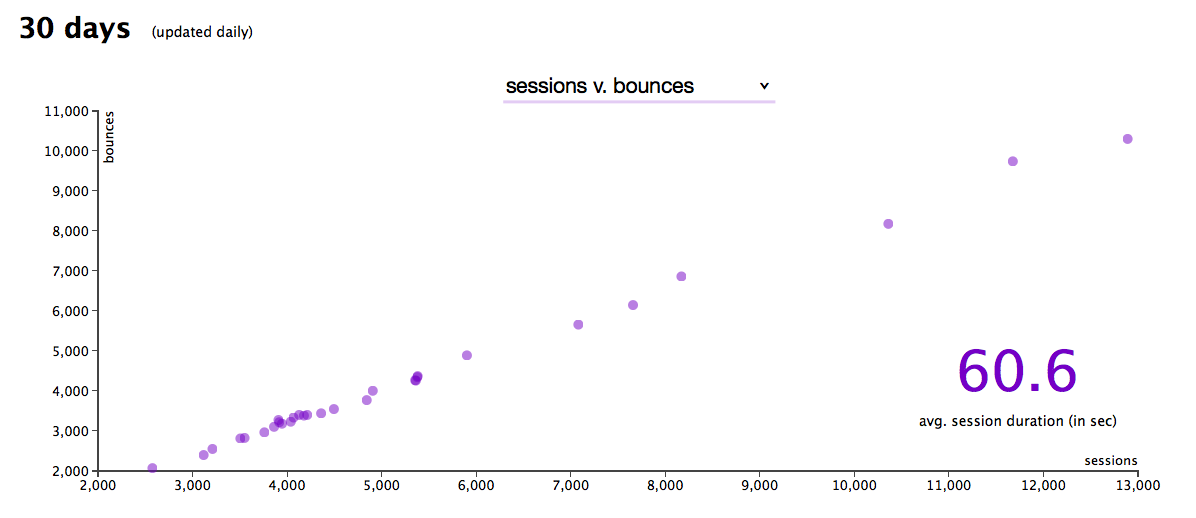
Lyst showing sessions vs. bounces over the past month in a scatter plot.
Using Google’s well-documented APIs, we’re able to query the data as we wish in our code. The data then populates our customized dashboards to show users the information they want to see.
We even added a bare-bones custom query page to manually query the data using the APIs.
Feel free to peruse our analytics with lyst. And of course, keep in mind that lyst doesn’t tell the whole story. In addition to dailybruin.com, readers get to our stories via the 9,000 papers we put on stands daily and our iOS app.
That means we’re also welcoming contributions or suggestions from any developers. Lyst definitely isn’t perfect and could use a bit of refactoring to make it more efficient and visually engaging.
If you’re interested in contributing or have any questions, please get in touch with us at [email protected].
Correction Sept. 24: The original version of this post incorrectly mentioned breaking news posts published on Sunday. In fact, the posts were published on Monday.
AUTHOR
Neil Bedi
Beditor in Chief
Neil is the creator of The Stack and was the data editor in 2014-2015. He was also a Daily Bruin Photo editor and a member of the Editorial Board. He currently works as an analyst at JPMorgan. He loves journalism, creating data visualizations, reminding people of their own mortality and a good beard.