Every time a student cards into a UCLA Recreation facility, the visit is time-stamped and recorded.
Last school year, 1.5 million visits were recorded like that.
These records tell us a lot about how students use each facility and could suggest when and where you should work out.
An obvious use of that data – all entrance records from the 2015-2016 school year – is to estimate how many people are in the gym at any given moment.
Because the anonymized records include only the time stamp of each entrance, but not the headcount inside a gym or the exit time stamp, we need a model to estimate traffic.
That model would have to account for not only people who entered at a particular time (for which we use the data) but also some proportion of the people who entered previously and remained (here’s where the model comes in). More details are explained later in the post.
A quick glance
The heat charts below show how busy each facility is at different hours of day and days of week. Because Wooden and BFit differ in size, we compare each facility’s traffic at each time period with the peak traffic at that facility. Peak traffic is defined as the average number of people at the gym during the busiest time period in a quarter.
Wooden
BFit
Let’s compare the traffic between the two facilities.
Choosing between Wooden and BFit
Wooden’s larger space means that it normally houses between two and three times as many people as
BFit. From time to time, BFit does reach about the same level of traffic as Wooden. In those cases, we might argue that Wooden is the better, less crowded place to work out. Conversely, when Wooden accommodates, for instance, more than 3 times as many people, BFit might be a better choice.
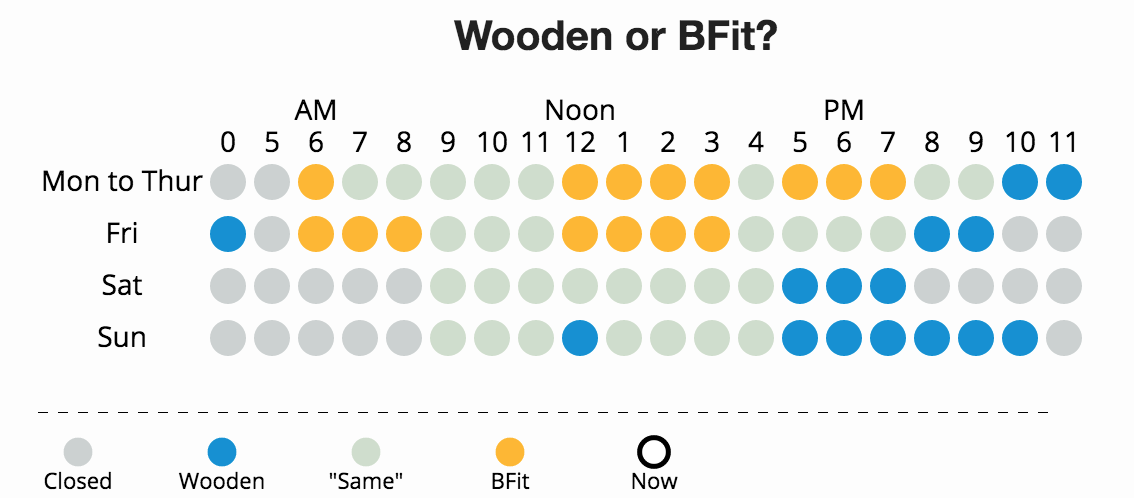
Wooden or BFit?
A couple patterns stick out:
On weekday afternoons, Wooden is unusually busier than BFit as students stay near campus in between classes.
BFit becomes more crowded on evenings and late nights as well as weekends when Hill residents prefer the short walk from dorms.
Live traffic estimate
Gym usage patterns are remarkably consistent. While UCLA Recreation doesn’t provide real time information, we can fairly safely estimate – in real time – how busy a gym is based on past data and the current time of day and day of week.
Right now, it’s likely that
Wooden is , and
BFit is .
Note: Beginning January 2017, Wooden will be open 24 hours on Monday through Thursday.
Go in-depth
The line chart below allows you to explore and compare gym traffic at a more granular level.
A few interesting insights:
Traffic dips between noon and around 1:30 PM on weekdays.
Traffic rapidly climbs from 2 PM onward until it reaches the peak at around 5:30 PM on weekdays.
BFit is busier than Wooden on weekends, especially on evenings. Weekend traffic at Wooden doesn’t appear to fluctuate that much throughout the day.
Less people exercise towards the end of a quarter.
More on BFit
The opening of BFit has given students who live on the hill or even in the apartments more options. But are Bruins really using BFit? Has BFit improve student’s overall health? Daily Bruin Radio reporter Sarika Bharil investigated the effects that BFit has had on student fitness. Listen to the episode.
Data and Model
UCLA Recreation officials graciously provided the dataset, which consisted around 1.5 million records in total, spanning from June 2015 to June 2016, and containing the time stamp, type of user (ie. undergrad, grad or staff), and facility name (ie. Wooden, BFit, KREC, or Sunset Rec) of each entrance.
Since the dataset doesn’t have exit time stamps, we have to guess how long each workout lasted – we need to find a distribution and good enough parameters using survey data. Sixty-five UCLA students responded to an online survey asking them how long they spent at the gym the last time they went. The Weibull distribution was chosen because of its suitability for modeling timed events, and parameters were then inferred from the survey data.
Once we have a distribution model, we assume each visitor in the records did the following:
Entered at actual time, provided by UCLA Recreation’s raw data
Remained for X number of time intervals, simulated from the model
Exited
Now we simply sum all the people who remained at each time point and do the necessary math to get the estimated average traffic for different times at each facility.
How reliable is the model? Estimates of the exact headcount varied considerably depending on model selection. But the relative difference between the different times of day, days of week, or weeks of quarter are very consistent so the trends shown in relative scales are reliable regardless of which model we pick.
AUTHOR
Tyson Ni
Data Viz Apprentice
Tyson likes telling stories with data. Feel free to send him feedback, data, or story ideas.